P6 Schedule Analysis Software: Create Your Free Account
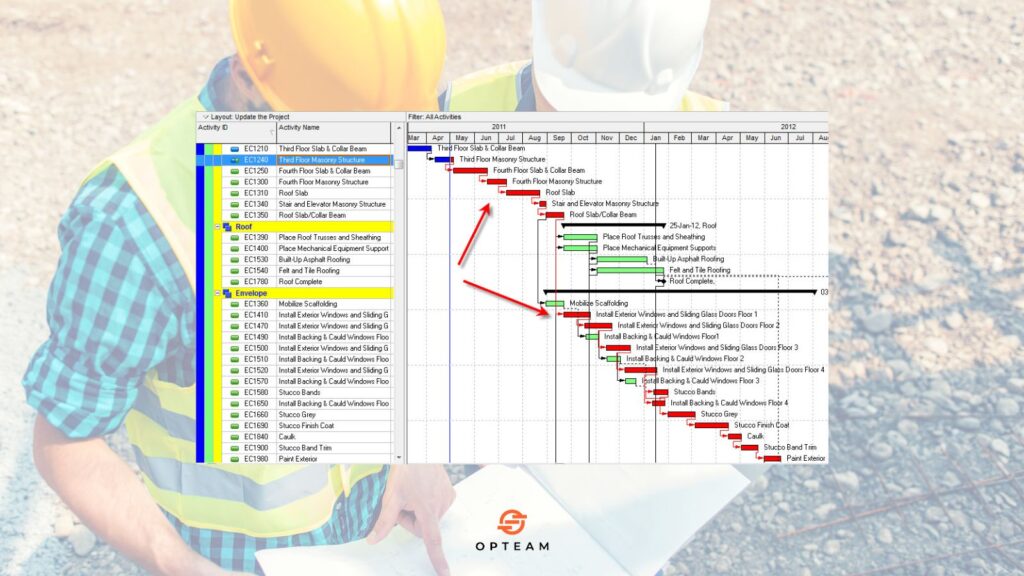
If you’re managing complex construction projects with Primavera P6, you already know the challenge: creating the schedule is one thing, but analyzing it for accuracy, progress, and delays is another story. That’s why more consultants and contractors are looking for P6 Schedule Analysis Software, tools that can go beyond the basics of Primavera and give you clear, actionable insights. Relying only on manual checks in P6 often leads to missed logic errors, unclear critical paths, and reporting that takes hours. By the time discrepancies surface, weeks of credibility and performance may already be lost. What you need is a solution that integrates directly with your P6 schedules, automatically analyzes them for risks and delays, and generates reports that clients and stakeholders actually understand. This is exactly what Opteam was built for. With Opteam, you can: Whether you’re a consultant verifying contractor updates or a contractor keeping your team accountable, Opteam helps you cut through the noise and focus on what really matters—delivering projects on time. 👉 Try it today: Sign up for free and see how schedule analysis can be done in minutes instead of days. What Is P6 Schedule Analysis Software and Why Do You Need It? Primavera P6 is the industry standard for project scheduling, but when it comes to analyzing a schedule for accuracy, performance, and risks, most teams quickly realize that P6 alone has limitations. That’s where P6 Schedule Analysis Software comes in. In simple terms, it’s a set of tools designed to make sense of complex schedules, highlight hidden problems, and deliver insights you can act on. Instead of relying solely on manual checks or gut feeling, these tools automate much of the heavy lifting. Why it matters: For consultants, this means no longer accepting “we’re on track” without verification. For contractors, it means proving progress and avoiding costly misunderstandings. With projects getting bigger and timelines tighter, relying only on manual analysis is no longer enough. Modern P6 Schedule Analysis Software bridges the gap, transforming raw P6 data into insights that drive smarter decisions and stronger project outcomes. Limitations of Primavera P6 in Schedule Analysis Primavera P6 is powerful for building schedules, but when it comes to analyzing them, many professionals run into roadblocks. Understanding these limitations is key to knowing why you may need complementary software. Some common challenges include: The bottom line: Primavera P6 is excellent for scheduling, but it wasn’t designed as a comprehensive analysis tool. Without specialized support, project teams risk missing red flags until it’s too late. This gap is exactly why P6 Schedule Analysis Software exists—to automate error detection, simplify reporting, and give teams reliable insights they can use to prevent disputes and delays. Key Features to Look for in P6 Schedule Analysis Software Not all tools are created equal. If you’re considering P6 Schedule Analysis Software, here are the features that matter most: 1. Schedule Health Checks 2. Critical Path Clarity 3. Progress vs. Plan Tracking 4. Delay Analysis Tools 5. Reporting Automation 6. Integration with Primavera P6 7. User-Friendly Interface Choosing a solution with these features ensures you’re not just adding another layer of complexity but actually simplifying your project controls workflow. The best software doesn’t replace Primavera P6—it complements it, making sure your schedules are both technically sound and practically useful. How Opteam Enhances Primavera P6 for Smarter Project Control While Primavera P6 is your foundation, Opteam is the smart layer on top that makes schedule analysis clear and actionable. Here’s how Opteam works with your existing P6 workflows: Instead of spending hours sifting through hundreds of activities in P6, Opteam gives you clarity in just a few clicks. For consultants, this means verifying contractor updates without endless back-and-forth. For contractors, it means showing proof of progress and protecting your position in case of claims. With Opteam, P6 Schedule Analysis Software becomes more than a buzzword—it’s a practical tool that saves time, reduces disputes, and keeps projects on track. 👉 Sign up here to experience smarter schedule analysis today. Start Using Our Tool For P6 Schedule Analysis Today Getting started with schedule analysis doesn’t have to be complicated. If you’re already using Primavera P6, adopting complementary software is the fastest way to upgrade your project controls process. Here’s how to begin: The benefits are immediate: faster insights, fewer disputes, and stronger credibility with clients and stakeholders. With deadlines and budgets under pressure, the smartest move is to empower your team with the right tools. 👉 Take the first step: Create your free account on Opteam and see how easy schedule analysis can be.
But-for Schedule Analysis in Construction

But-for Schedule Analysis is a forensic delay analysis method used in construction to determine the impact of specific delays on a project’s overall completion date. The approach works by asking the question: but for the delay event, when would the project have finished? Analysts take the original schedule and remove the delay(s) under review, then recalculate the completion date to see how much earlier the project would have concluded. This isolates the direct effect of the delay, separating it from other issues or concurrent events. In practice, this method is often used in disputes to establish cause-and-effect between a delay event and the project’s late completion. Use Cases for But-for Schedule Analysis 1- Dispute ResolutionBut-for Analysis is widely used in construction claims and disputes to demonstrate how specific delays impacted project completion. By showing the hypothetical outcome if the delay had not occurred, it provides a strong evidentiary basis in arbitration or court proceedings. 2- Assessing Contractor LiabilityOwners and consultants often use this method to evaluate whether a contractor is responsible for a project’s late delivery. It helps determine if the delay event was critical and directly attributable to the contractor’s actions or inactions. 3- Extension of Time (EOT) ClaimsContractors use But-for Analysis to justify requests for additional time. By removing employer-caused delays from the schedule, they can demonstrate that completion would have been achieved earlier without those delays, strengthening their entitlement to an EOT. 4- Insurance and Risk AssessmentIn cases involving delay-related insurance claims, this method helps quantify the actual impact of disruptive events (e.g., extreme weather, labor strikes) on the project timeline, supporting fair compensation. 5- Forensic Project ReviewBeyond disputes, project teams sometimes use But-for Analysis retrospectively to understand the root causes of delays and improve planning practices for future projects. Pros & Cons Pros Cons Provides a clear cause-and-effect link between specific delays and project completion. Relies heavily on the accuracy of the baseline schedule, which may be flawed or unrealistic. Widely accepted in legal and arbitration proceedings due to its logical simplicity. Can oversimplify complex projects with multiple overlapping or concurrent delays. Useful for both owners and contractors in demonstrating entitlement or liability. Often requires significant data manipulation, which may be disputed by opposing parties. Creates a hypothetical “what-if” scenario that is easy to communicate to non-technical stakeholders. May ignore real-world project dynamics, such as resequencing of work or mitigation measures. Helps quantify time impacts in extension of time (EOT) and compensation claims. Time-consuming to prepare and validate, especially for large-scale projects. How the But-for Method Works in Practice The But-for Schedule Analysis starts with the project’s baseline or updated schedule, which serves as the reference point for evaluating progress and delays. The analyst identifies the delay event or events in question—such as late material delivery, design changes, or labor shortages—and then removes them from the schedule. By recalculating the completion date without those delays, the method reveals the hypothetical finish date that “would have” occurred if the delay had never happened. This process creates a direct comparison between the actual completion date and the adjusted “but-for” completion date. The difference between the two represents the time impact of the delay. For example, if a project finished 60 days late but the analysis shows that without the employer-caused delays it would have been only 20 days late, then 40 days of delay can be attributed to the employer. This practical, step-by-step approach makes the But-for Method highly effective in isolating responsibility and providing a defensible explanation of delay impacts. Common Challenges in Applying But-for Analysis While the But-for Method is straightforward in theory, applying it in real projects often comes with challenges. One of the biggest issues is the reliability of the baseline or updated schedule used for the analysis. If the original schedule was unrealistic, incomplete, or poorly maintained, then the “what-if” scenario created by removing delays may not accurately reflect real project conditions. This can lead to disputes over the validity of the findings. Another challenge lies in projects with multiple overlapping or concurrent delays. The But-for Method focuses on isolating the effect of a single delay, but construction projects often face several disruptions at the same time. In such cases, separating the true impact of each delay becomes complex and may oversimplify reality. Additionally, opposing parties in disputes often argue over how delays are modeled or whether mitigation efforts—like resequencing or accelerating work—were properly accounted for. These factors can make the method time-consuming and subject to debate, despite its apparent simplicity. But For Schedule Analysis Example Imagine a construction project with a planned duration of 12 months. Halfway through the project, the contractor experiences a 30-day delay due to late delivery of critical steel materials. The project ultimately finishes 60 days late. To understand how much of that delay is attributable to the late steel delivery, a But-for Schedule Analysis is performed. The analyst takes the updated schedule and removes the steel delivery delay, then recalculates the completion date. The results show that, without this delay, the project would have been completed only 25 days late. This means that out of the total 60 days of delay, 35 days can be directly attributed to the steel delivery issue. The remaining 25 days are due to other factors, such as slower-than-expected labor productivity or weather disruptions. By isolating responsibility in this way, the analysis provides a clear, evidence-based breakdown of delay causes. Make But-for Schedule Analysis Faster and More Accurate with Opteam When performing a But-for Schedule Analysis, accuracy and efficiency are crucial. Traditionally, gathering as-built data, comparing it to planned schedules, and isolating the “but-for” delays can take weeks of painstaking work. Opteam changes that. With Opteam, consultants, contractors, and project managers can instantly import Primavera schedules, track real-time progress, and automatically identify deviations that matter. The platform highlights which delays truly impacted your project, so you can focus your analysis where it counts. Detailed reports and visual dashboards make presenting your findings to clients or stakeholders clear, concise, and defensible. Whether you’re
Impacted As-Planned Delay Analysis in Construction

Impacted As-Planned Delay Analysis is a prospective method used in construction projects to measure the effect of delay events on the project completion date. In this approach, the analyst takes the original baseline schedule (the as-planned program) and introduces the identified delay events into it one by one or in groups. By observing how each inserted delay impacts the planned finish date, the method aims to demonstrate the potential time impact of those events if they were to occur exactly as scheduled. This technique is often used to support claims for extensions of time because it provides a clear, step-by-step model of how delays would have influenced the project if everything else had proceeded according to the original plan. However, it does not account for the actual progress or changes that occurred during construction, which means it may not fully reflect real-world circumstances. Instead, its value lies in offering a straightforward and easily understandable forecast of delay impacts based on the as-planned schedule. How the Impacted As-Planned Method Works he Impacted As-Planned method works by taking the project’s baseline schedule and inserting delay events into it to assess their effect on the overall completion date. Each delay, such as late delivery of materials, design changes, or unforeseen site conditions, is modeled in the as-planned program as if it occurred exactly when expected. The analyst then measures how much the project’s finish date is pushed forward once the delay is incorporated. This step-by-step process creates a direct link between each identified delay and its projected time impact. Because it is based entirely on the baseline schedule, the method assumes that all other activities progress exactly as originally planned, without considering changes or disruptions that may have happened on-site. This makes the analysis relatively simple, transparent, and easy to follow, which is why it is often used in claims preparation. However, the accuracy of the results depends heavily on the reliability of the baseline program and the proper identification of delay events. Advantages of Using Impacted As-Planned Analysis 1- Clarity and Transparency 2- Useful for Claims 3- Prospective Application 4- Cost and Time Efficiency Limitations and Criticisms of the Approach The main limitation of the Impacted As-Planned approach is that it relies entirely on the baseline schedule and assumes that work progresses exactly as originally planned. In reality, construction projects often experience changes, resequencing, or productivity variations that are not reflected in the baseline. As a result, this method may oversimplify the situation and produce outcomes that do not accurately represent what happened on-site. Its reliance on the original program also means that if the baseline schedule is poorly prepared or unrealistic, the analysis becomes weak and unreliable. Another common criticism is that the method tends to favor the party introducing the delays, often the contractor, because it does not account for actual progress or concurrent delays. By ignoring how events unfolded in real time, it may exaggerate the impact of certain delays or fail to reflect shared responsibility. For this reason, tribunals and project owners sometimes view the results as less persuasive compared to more sophisticated methods, such as time impact analysis or as-built studies, which incorporate actual project data. When to Use Impacted As-Planned in Construction Projects Situation Why This Method Works Well Early in the Project Useful for forecasting potential impacts of delays before significant work has been completed. Simple or Medium-Sized Projects Provides a straightforward way to assess delays without requiring complex analysis. Supporting Extension of Time Claims Creates clear, step-by-step evidence that links delay events to changes in project completion. When Stakeholders Need Transparency Easy to explain and present in meetings, negotiations, or disputes. Limited Time or Budget for Analysis Faster and more cost-effective than advanced methods like as-built or time impact analysis. See Delay Impacts Instantly with Opteam: From Baseline to Actionable Insights With a construction progress tracking software like Opteam, you can transform your baseline schedule from a static plan into a live, interactive tool for delay analysis. Instead of manually inserting events and calculating impacts, Opteam automatically integrates with Primavera and other scheduling software to simulate potential or actual delays in real time. This allows project managers to instantly see how delays affect the completion date, generate professional reports for stakeholders, and take proactive steps to mitigate risks. By combining the principles of Impacted As-Planned analysis with powerful digital automation, Opteam makes schedule management faster, more accurate, and easier to defend in claims or project discussions.
BEST Guide: Understand Finish to Start Dependency in Construction Projects

A Finish-to-Start (FS) dependency is the most common relationship used in construction scheduling. It simply means Task B cannot start until Task A is fully finished. For example, you can’t start installing drywall until the framing is complete, the successor activity is locked behind the predecessor’s completion. This relationship helps planners sequence work logically, avoid overlaps that could cause rework, and build a schedule that reflects how construction actually happens on-site. In practice, FS dependencies are used throughout project schedules in tools like Primavera P6 or MS Project to define workflow, calculate the critical path, and forecast delays. They also allow planners to add lags, such as waiting 2 days after pouring concrete before removing formwork. Why Finish-to-Start Dependencies Matter in Construction Scheduling Finish-to-Start (FS) dependencies are the foundation of construction schedules. They define that one activity cannot begin until another finishes. Without FS logic, your schedule is just a list of tasks — it won’t reflect how work actually flows on-site. Key reasons FS matters: Example: If concrete curing takes 7 days, FS logic ensures that floor finishes don’t start until curing is complete. This prevents unrealistic start dates and avoids costly mistakes. FS dependencies also support resource planning. Knowing the sequence allows project managers to allocate crews, equipment, and materials efficiently. And with modern AI tools, FS logic can be analyzed to detect missing connections, unnecessary lags, or risky sequences — making your schedule smarter and more reliable. How FS Dependencies Affect the Critical Path The critical path is the series of tasks that determines the project’s minimum duration. FS relationships heavily influence which tasks end up on this path. Important points: Practical tip: If a structural task delays, planners can sometimes convert FS to Start-to-Start (SS) with a small overlap to recover time, but this requires careful analysis. FS dependencies also make forecasting and reporting more accurate. Software recalculates timelines automatically, showing how a slip in one activity affects project completion. AI tools can even flag unrealistic FS chains or excessive lags, helping planners proactively manage the schedule. In short: FS dependencies are not just a technical detail, they are the backbone of your schedule’s predictability, accuracy, and critical path integrity. FS vs Other Dependency Types: SS, FF, SF Explained Dependency Type Definition Example in Construction When to Use Finish-to-Start (FS) Task B cannot start until Task A finishes Drywall installation starts only after framing is complete Most common; use for sequential tasks Start-to-Start (SS) Task B cannot start until Task A starts Painting starts at the same time the drywall is being installed When tasks can overlap partially Finish-to-Finish (FF) Task B cannot finish until Task A finishes Electrical testing cannot finish until conduit installation finishes When completion of tasks must be synchronized Start-to-Finish (SF) Task B cannot finish until Task A starts Security setup must remain until site evacuation starts Rarely used; for specialized scenarios or handover dependencies Quick notes: Tips for Setting Up FS Logic Without Errors Always define clear predecessors and successorsMake sure every FS link has a logical reason, avoid linking tasks just to “fill the schedule.” Check for circular dependenciesFS errors often happen when a task accidentally depends on its own successor. Most scheduling tools will flag this, but a manual check helps. Use realistic durationsDon’t create FS links with tasks that finish unrealistically fast; this can create artificial delays downstream. Apply lag only when necessaryLags (waiting periods between FS tasks) should reflect real-world constraints, like curing concrete or drying paint. Avoid unnecessary FS linksOver-linking can make schedules rigid and difficult to update. Only link tasks that truly need sequencing. Validate with the teamConfirm FS dependencies with site engineers and subcontractors to ensure the sequence makes sense on-site. Regularly audit the scheduleUse scheduling software or AI tools to detect missing links, excessive lags, or illogical FS chains. Document your logicShort notes on why a dependency exists help new planners understand the schedule and avoid mistakes later. Keep critical path in mindFocus FS accuracy on tasks affecting the critical path — small errors there can delay the whole project. Test schedule changes before committingAny changes to FS links should be simulated to see the effect on timelines and float. Take Control of Your Schedule with Your Own AI Imagine having a private AI that fully understands your company’s projects, workflows, and scheduling logic — including all your FS dependencies. With Opteam, you don’t need to manually track every link or worry about misconfigured sequences. Simply upload your project files, and your AI is ready to provide instant insights, detect risky FS chains, and generate accurate progress reports. Stop guessing which tasks are critical or which delays will cascade through your project. With your own company-trained AI, you can: Take the first step toward smarter, faster, and more reliable scheduling. Create your free Opteam account today and turn your project data into actionable insights.
As Built Drawings in Construction: All What You Need to Know

As-built drawings are updated versions of construction drawings that reflect the exact conditions of a project after it’s been built. Unlike design drawings that show how things are supposed to be, as-builts show how they actually ended up on site, including any changes, reroutes, material substitutions, and dimensions. These drawings are usually developed progressively throughout construction, capturing every modification made due to on-site constraints, unforeseen clashes, client changes, or value engineering decisions. By the end of the project, the as-built set becomes the most accurate representation of the structure. Contractors, consultants, and facility managers rely heavily on as-built drawings for future maintenance, renovations, system upgrades, and dispute avoidance. They help locate concealed services like electrical conduits, HVAC ducts, and plumbing pipes, preventing costly rework or accidental damage later on. In many jurisdictions, submitting as-builts is mandatory for project handover or occupancy certification. Ultimately, they serve as a long-term knowledge base, reducing lifecycle costs and providing clarity for everyone operating the building after construction teams move on. As-built drawings requirements General Requirements Technical Content Formatting & Standards Submission & Approval Who is responsible for as-built drawings? As-built drawings are primarily the responsibility of the contractor. Throughout construction, the contractor must track every change made on site compared to the original design, update the drawings accordingly, and coordinate with subcontractors to capture accurate locations of architectural elements, structural modifications, and MEP services. Site engineers, supervisors, and subcontractors contribute field measurements, mark-ups, and redlines so the contractor can continuously maintain an up-to-date record of all deviations, reroutes, and material substitutions made during execution. The consultant (or supervising engineer) is responsible for reviewing, verifying, and approving these as-built drawings before handover. They check accuracy, completeness, and compliance with project requirements. In some projects, the client or facility management team may request additional details for future maintenance. Ultimately, the contractor produces them, subcontractors contribute data, and the consultant signs them off as part of the final close-out package. How to create as-built drawings? Creating as-built drawings starts during construction, not after. The contractor and site team document every deviation from the original design using field measurements, mark-ups, and digital redlines as work progresses. This includes routing changes, shifted dimensions, substituted materials, and hidden services. Site engineers collect data through inspections, photos, and coordination with subcontractors, ensuring nothing is missed before elements are covered up. Accurate and continuous record-keeping is key, because relying on memory at the end of the project usually leads to errors. Once the project is complete, these field notes are consolidated into clean CAD, PDF, or BIM drawings that reflect the exact final conditions. All revisions must be clearly labeled, dated, and reviewed by the consultant for approval. Equipment tags, capacities, and installation details are added for maintenance reference. Before submission, the drawings are checked for consistency, legibility, correct layering, and compliance with project standards. When approved, the as-builts are included in the handover package for the client and facility management team. How much do as-built drawings cost? The cost of as-built drawings varies based on project size, complexity, and the level of detail required. Small residential projects can range from a few hundred dollars up to around a thousand, while commercial or industrial sites are typically priced per square meter or per square foot. For larger buildings with complex mechanical, electrical, and plumbing systems, the price increases due to the extra coordination and verification required. In some cases, costs can rise further if the original drawings are missing or outdated, since more field verification is needed. Pricing models commonly include a flat project fee, a rate per drawing sheet, or an area-based rate. More advanced deliverables like BIM models, laser scanning, or highly detailed asset tagging can push the cost higher. Factors such as limited site access, tight deadlines, and heavy design changes also add to the price. Ultimately, the cost reflects how much effort is needed to accurately document the real-world conditions of the finished construction. Streamline As-Built Documentation with Opteam Managing updates manually throughout a project leads to missing information, late mark-ups, and handover headaches. Opteam solves this by centralizing site progress, automatically collecting updates from the field, and keeping your project data clean and accurate as construction evolves. Engineers can effortlessly track changes, generate reports, and maintain a reliable record of what was actually built — without chasing subcontractors or sorting through spreadsheets. With Opteam, you gain a smarter, more organized workflow that reduces rework, improves handover quality, and speeds up as-built preparation. Your project history becomes searchable, structured, and ready for future reference. Stop managing chaos and start building clarity. Take control of your construction data — try Opteam free for two weeks at this link.
Best Contractor Tracking Software – Built for Consulting Companies

When you run a consulting company, contractor tracking can get messy fast. You’re chasing site updates on WhatsApp, waiting on weekly reports, digging through spreadsheets, and trying to explain progress to clients while half the information is already outdated. It is stressful, slow, and honestly, not what you should be spending hours on. That’s why consulting firms are starting to look for contractor tracking software built specifically for the way they work, not another generic project tool. And this is where Opteam stands out. You upload your project documents, and Opteam automatically learns from them to track progress, communicate with site teams, and give you real-time visibility without all the manual busywork. If you are tired of surprises, late updates, and scrambled reporting before client meetings, keep reading. This article breaks down why Opteam is becoming the go-to contractor tracking platform for consulting companies that want control, clarity, and clean reporting without the chaos. Why Consulting Firms Need Contractor Tracking Software Now Consulting companies live and die by clarity. Your clients expect accurate progress updates, clean reports, and confident answers when something slips. But relying on spreadsheets, forwarded WhatsApp messages, and weekly PowerPoints puts you permanently on the back foot. By the time you gather updates from contractors, the information is already outdated. Contractor tracking software solves that gap. It gives consultants live visibility into what is happening on site, who is responsible for each activity, and how actual progress compares to the baseline plan. Instead of chasing updates, you get automatic reminders, structured inputs, and a real-time dashboard that highlights delays before they snowball. More importantly, contractor tracking protects your professional reputation. You avoid awkward client meetings, last-minute report scrambles, and arguments about “who said what” because the data is centralized and timestamped. It also strengthens your ability to validate claims, justify extensions, and support commercial discussions with facts rather than assumptions. In short: the old way was manageable when you had fewer projects, smaller teams, and slower timelines. Today’s consulting environment moves too fast and demands too much transparency. Modern firms need a system built to keep contractors accountable and give you instant answers whenever a client asks. That is why dedicated contractor tracking software has shifted from optional to essential. Key Features to Look For in Contractor Tracking Software Real-Time Progress Visibility Across All Contractors Consulting firms rarely struggle with planning, they struggle with knowing what’s actually happening on site. Real-time visibility lets you see progress the moment it’s reported, instead of waiting for weekly PDFs or phone calls. You immediately spot slipping activities, underperforming contractors, and delayed handovers. When a client asks “how are we doing?”, you have an answer in seconds — not after three emails. Automated Communication With Site Teams (No Manual Chasing) A big chunk of a consultant’s week is wasted chasing site engineers and subcontractors for updates. Automation should handle that. Daily or weekly reminders go out on your behalf, collect structured progress inputs, and push them straight to your dashboard. No more WhatsApp chaos, missing updates, or awkward follow-ups. Centralized Source of Truth for Claims, Delays, and Approvals When documentation is scattered, disputes turn into headaches. A centralized system keeps every update, confirmation, and delay note in one place — timestamped and linked to the schedule. When extensions of time, variation orders, or claims come up, you’re backed by clean evidence. This saves you hours of forensic digging later. AI-Generated Reports and Dashboards in Seconds, Not Weeks Reporting is where consultants lose productivity. Weekly decks take hours to assemble, cross-check, and format. AI can generate progress summaries, delays, impacts, and charts instantly. You spend time reviewing insights instead of building spreadsheets. And clients love fast, data-driven reports. Easy Upload of Project Documents to Kickstart Tracking Instead of manually configuring the system line by line, you should be able to upload schedules, BOQs, drawings, anything your consultant workflow already uses. The system reads the structure, maps activities, and starts tracking immediately. It reduces onboarding friction and removes the need for technical configuration skills. Schedule Comparison: Planned vs Actual Progress Progress only matters compared to plan. Good software clearly shows baseline vs actual, identifies slippages, flags activities at risk, and highlights where productivity is slow. This comparison drives better conversations with contractors, and helps you proactively prevent delays instead of reacting to them. Role-Based Access and Secure Data Control for Consultants Consulting firms deal with confidential client information, and not everyone should see everything. Role-based access lets you decide who can view, edit, approve, or upload. You maintain compliance, protect sensitive data, and ensure contractors only see what they’re supposed to. Historic Data Insights to Improve Future Project Planning Consultants rarely get the chance to learn from past projects, because data lives in folders nobody opens again. AI can surface patterns: recurring delays, seasonal productivity drops, typical durations, realistic outputs. These insights improve planning accuracy and make you look sharper in client conversations. Mobile-Friendly Updates for On-Site Teams If updating progress requires a laptop, it won’t happen consistently. Mobile inputs give on-site teams a simple form to submit progress, photos, comments, and blockers. It reduces excuses, increases update frequency, and keeps you continuously informed no matter where people are. Audit-Ready Documentation for Client Meetings Client meetings are easier when everything is documented. Instead of scrambling through slides and screenshots, you can pull up a clean timeline of updates, issues, and resolutions. When a delay is questioned, you have timestamps, communications, and supporting data. That credibility builds trust — and protects fees. Why Opteam Outshines Generic Project Management Tools Most project management platforms weren’t built for the realities of consulting in construction. They’re good at task lists and timelines, but they don’t solve the painful workload that consultants face every week: chasing contractors for updates, preparing progress reports, defending timelines, and answering tough questions in client meetings. That’s where Opteam separates itself. Opteam is designed around how consulting companies actually work. Instead of forcing you to manually feed it data, you simply upload
Quantitative Schedule Risk Analysis: Full Guide
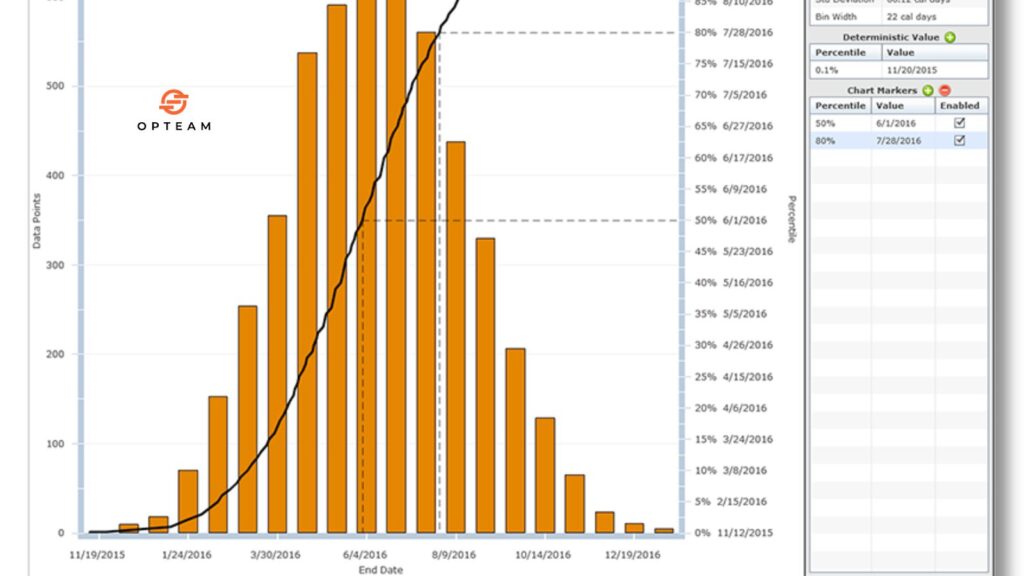
Construction schedules rarely go exactly as planned. Weather shifts, late approvals, supply hiccups, and subcontractor performance can quickly turn a confident timeline into a scramble. Yet many schedules are still built on single-point duration estimates, assuming every activity finishes exactly on time. That’s where Quantitative Schedule Risk Analysis (QSRA) becomes essential. QSRA applies probabilities and data-driven simulations to your schedule to show how uncertainties will actually impact project completion. Instead of guessing, you can measure schedule risk, predict realistic finish dates, and understand which activities are most likely to blow up the timeline. The result? Better contingency planning, stronger negotiation power, fewer surprises, and far more credible communication with owners and stakeholders. In this guide, we break down QSRA from the ground up, what it is, how it’s done, the tools involved, and why it’s becoming a standard requirement in major construction programs. Whether you’re a planner, contractor, or client-side PMO, you’ll learn exactly how QSRA turns a baseline schedule into a risk-aware roadmap that protects both deadlines and profit margins. What is Quantitative Schedule Risk Analysis? Quantitative Schedule Risk Analysis (QSRA) is a method used in construction project management to measure how risks and uncertainties will affect a project’s timeline. Instead of assuming every task finishes exactly on its planned duration, QSRA assigns probability ranges to activities and runs thousands of simulations to reveal a realistic range of completion dates. This gives planners and stakeholders visibility into the likelihood of meeting key milestones and the amount of schedule contingency they should carry to protect the finish date. QSRA also identifies the specific activities and risks that have the greatest potential to delay the project, helping teams focus their mitigation efforts where they matter most. Because the results are based on statistics rather than subjective judgments, QSRA strengthens negotiations during progress reviews, supports defensible claims when delays occur, and improves decision-making throughout the project lifecycle. How Quantitative Schedule Risk Analysis Works in Practice QSRA might sound complex, yet the workflow is straightforward once you see the steps. It connects real project schedules with real risk exposure to show what is actually possible, not what we hope will happen. The Inputs That Matter To perform QSRA, you need three main components These three points allow the simulation to understand how durations might shift in reality. Procurement packages may take longer than expected. Weather windows might shrink. Approvals may slip. The model captures all that. Monte Carlo Simulation Here is where the analysis becomes powerful. The engine tests thousands of schedule outcomes under uncertainty. Each run uses different duration combinations and risk triggers. The output is a full picture of how likely each finish date really is. The biggest difference from a baseline is simple. A normal schedule gives you one date. QSRA gives a confidence curve that tells you the truth. For example This is real risk control. It exposes what could go wrong before it becomes a claim, while clearly showing what needs attention now to protect the finish line. Why QSRA Is Essential for Contractors and Consultants Construction is full of uncertainty. What QSRA does is transform that uncertainty into measurable, defensible intelligence. It shifts teams from reacting to problems to anticipating them. The Strategic Benefits Owners appreciate QSRA because it prevents surprises. Contractors appreciate it because it provides evidence. When delays happen, QSRA results help demonstrate which risks were unavoidable and which were already identified. This becomes critical in determining entitlement for time extensions. Protecting Profitability A late project means extra staff, extended preliminaries, liquidated damages and damaged reputation. QSRA flags the financial consequences of slippage early enough that teams can still intervene. It highlights the top risk drivers, the activities that deserve the most attention and mitigation. In short, QSRA improves trust and reduces disputes. It proves who managed the schedule responsibly and who did not. It is not only a risk tool, it is a claims defense shield and a credibility booster for project teams. The Tools Used for QSRA and How They Connect to Primavera Primavera P6 is the backbone of many project schedules. QSRA builds on top of it. Think of it like thisP6 creates the plan, while QSRA validates whether that plan is actually achievable. How They Work Together Common Tools Used With Primavera These tools plug into the schedule and generate charts such as confidence curves and tornado diagrams. They also allow scenario planning, what if the steel package arrives late, what if approvals take three weeks longer. With this capability, planners become proactive. They make decisions before delays crystallize. Software alone is not enough though. The strength of QSRA depends on the maturity of the schedule. Clean logic, realistic sequencing and accurate durations are the foundation. When those are strong, QSRA gives unmatched clarity that a static baseline simply cannot deliver. Understanding Confidence Levels: P50, P70, P80 and What They Mean for Decisions QSRA outputs are often summarized using confidence levels. These show how likely it is to achieve a specific completion date. Instead of giving stakeholders a single promise, planners present a set of outcomes backed by probability. The Most Common Confidence Points A P50 finish date is technically possible, yet risky. A P80 finish date is safer but may require longer delivery. Stakeholders choose which point to adopt depending on project complexity, contract conditions, and risk appetite. Why It Matters in Real Conversations Imagine your project has a baseline finish by December 10. QSRA results might show Now the question becomes a leadership decisionDo we hold to December and invest in mitigationOr do we realign expectations based on modeled reality Without QSRA, this discussion would be guesswork. Confidence levels turn it into strategic planning. Common Mistakes That Make QSRA Results Misleading Even the best simulation tools cannot fix a weak foundation. QSRA is extremely sensitive to schedule quality. When the inputs are flawed, the outputs can be dangerously deceptive. Frequent Issues When risk data is poorly aligned with real project behavior, QSRA becomes noise instead of insight. Results
Can Excel open a XER file? And a Better Easy Alternative

In simple words, no, Excel cannot open an XER file. XER is the extension of Primavera P6 construction schedule files that are used widely in construction. And the fact that you’re trying to open them with Excel means that you’re losing a very precious chance of getting instant insights and visualize your construction schedule easily. You might be asking, how? The answer is simple, it’s through Opteam construction progress tracking software. And while we offer custom quotes based on project size & number of users, we do offer a free trial that you can use to get instant AI generated insights on the health of your XER file without the need to do it manually through boring Excel sheets. How to Open an XER file with Opteam? 1- First go to this link and create your free account. 2- During onboarding, you will be asked to upload your P6 file. 3- Continue the onboarding steps. 4- Head to Projects, click on your project name. 5- A custom dashboard will open that has a score out of 100 that reflects how health your P6 file is, with AI generated insights on issues present in the file and how to fix them. Why Excel Sucks for Construction? Let’s face it, Excel is from the sixties. And after all, it wasn’t built for construction, it’s just another boring spreadsheet app. Despite this, most construction companies are still using it to manually collect progress data. They waste time (more than two weeks) to consolidate a simple report that’s when ready, it’s already too late and the effect of the delay already happened. Alternatively, top construction companies like Dar Al Handasah are using Opteam to automated this process. How? Basically, what Opteam does is that it automates the progress tracking process by communicating with site teams through Whatsapp. It sends automatic Whatsapp messages that has progress update forms to collect data from your site teams on your behalf. This data is automatically integrated into your P6 files, and is reflected on your custom dashboards. This replaces the traditional way of collecting data in construction that’s been there since ages, which constitutes of first sending manually created Excel files to site teams, waiting for more than two weeks for them to get back with manual updates, and then manually adding this data to P6 files, which is: Ready to Open & Analyze your P6 Files for free Without Primavera and Excel? Create your free Opteam account now, upload your P6 files and get AI generated insights for free!
Construction Delay Impact Estimator

Construction Delay Impact Estimator | Opteam 🏗️ Construction Delay Impact Estimator Total Project Duration (days) Planned Completion Date Activity Delay (days) Is the Activity on the Critical Path? YesNo Estimated Cost per Day (optional) Estimate Delay Impact 📊 Delay Impact Summary Common Causes of Construction Delays and How to Anticipate Them Construction projects are complex operations with many moving parts, and delays often happen when just one element breaks down. Some of the most frequent causes include design changes mid-project, slow approvals, poor weather conditions, supply chain disruptions, and labor shortages. Another hidden cause is incomplete planning at the start of a project. When schedules are unrealistic or lack clear milestones, every small setback snowballs. Subcontractor coordination can also lead to bottlenecks — if one trade is late, the next can’t start on time. To anticipate delays, teams should start with a realistic baseline schedule that includes contingencies for risk-prone activities. Regular schedule health checks help flag issues early, like tasks running behind or resource overload. Clear communication channels between the owner, general contractor, and subs ensure that decisions aren’t delayed when unforeseen challenges appear. Technology can also help: real-time progress tracking gives managers an early warning system before issues turn into costly delays. While delays can’t always be avoided, spotting the warning signs early can keep a small slip from turning into a major disruption. Pro tip: Tools like Opteam give you real-time schedule health insights so you can catch risks before they become costly delays. The Financial Impact of Project Delays on Contractors and Owners Delays are not just inconvenient — they’re expensive. Every extra day on site means higher overhead costs, from field supervision to rented equipment and temporary utilities. Owners often face extended financing costs and delayed revenue streams, while contractors risk liquidated damages if deadlines aren’t met. For example, a 200-day project delayed by 10% adds 20 extra days of cost. If the daily overhead is $5,000, that’s an additional $100,000 before accounting for claims or penalties. Supply chain fluctuations can also increase material prices if schedules slip into a new season or market condition. Another cost comes from lost opportunity. Owners can’t use or lease the completed facility, and contractors can’t move resources to the next job. This ripple effect can reduce margins on future work. To avoid financial surprises, it’s crucial to monitor delay exposure continuously. Early identification lets teams implement mitigation strategies — resequencing work, increasing crews, or negotiating time extensions. Understanding the true cost of each delay day helps decision-makers act fast when schedules start slipping. Want to see the financial impact of delays in real time? Opteam helps you track schedule changes and cost exposure instantly. How Delays Affect Project Schedules, Cash Flow, and Claims When a project falls behind, the impact extends beyond the calendar. Schedules shift, forcing trades to work out of sequence, which can increase inefficiency and risk rework. Cash flow also suffers. Contractors may have to pay labor and equipment costs for longer, while progress payments from owners are delayed. This strains working capital and can lead to borrowing or slower payment to subcontractors. Delays are also a breeding ground for claims and disputes. If no clear delay analysis exists, contractors and owners often disagree on who’s responsible for extra time and cost. These conflicts can escalate to formal claims, arbitration, or litigation — all of which are expensive and time-consuming. To reduce this chain reaction, projects should maintain accurate, up-to-date schedules and document changes carefully. Clear records allow teams to demonstrate delay causes and negotiate extensions or compensation fairly, avoiding disputes later. With Opteam, you get automated progress updates and delay impact visuals that make claims discussions clear and data-backed. Best Practices for Minimizing and Managing Construction Delays Managing delays starts long before they happen. Successful teams use a combination of planning, monitoring, and response strategies: Equally important is documenting every change and keeping stakeholders informed. Transparent, data-backed reporting reduces conflict and helps secure time extensions when delays are outside your control. Opteam automates schedule health checks and real-time reporting so you can act on risks before they cause costly project delays. The Role of Accurate Delay Analysis in Avoiding Disputes Delay analysis isn’t just paperwork — it’s a critical defense against claims. When a project is late, the first question is always: Why? Without clear records, everyone points fingers, and disputes can escalate quickly. Accurate delay analysis creates a timeline of events, showing when the delay happened, how it impacted the critical path, and who was responsible. This evidence is essential when requesting time extensions or defending against liquidated damages. Different methods exist — from as-planned vs. as-built comparisons to time impact analysis (TIA). The key is keeping schedules updated so the analysis is based on real progress data, not assumptions. For owners, a transparent delay record supports fair decision-making and prevents inflated claims. For contractors, it provides a solid case when delays are caused by design changes, late approvals, or unforeseen conditions. Ultimately, delay analysis turns potential legal battles into informed conversations, helping both parties reach fair resolutions faster and avoid costly litigation. With Opteam, delay analysis is automated and backed by real-time project data, making claims and extensions easier to manage.
Punch List in Construction: Meaning, Sample & More

A punch list in construction is a document prepared near the end of a construction project that outlines work that does not meet contract specifications and must be completed or corrected before final payment. It is typically created during a walkthrough involving the contractor, client, and sometimes the architect or project manager. Why Punch Lists are Important? Punch lists are a critical part of the construction process because they ensure that all contracted work has been completed correctly and to the client’s satisfaction before the project is officially closed. They serve as a final check to catch any missed or substandard work, protecting both the client and the contractor by clarifying responsibilities and expectations. Key Reasons Punch Lists Are Important: Punch Lists Components in Construction A punch list in construction typically includes specific items that need correction or completion before a project is deemed finished. These components ensure a thorough review of the project and provide a structured approach to addressing outstanding issues. Below are the main components commonly found in a construction punch list: 1. Item Description Each entry on the punch list should have a clear and concise description of the issue. This might include incomplete work, defects, or deviations from the project specifications—such as missing fixtures, uneven paint, or improperly installed hardware. 2. Location of the Issue The exact location of each item must be identified to avoid confusion. This could be a specific room, floor, or section of the construction site (e.g., “Room 203 – Left wall near window”). 3. Assigned Responsibility The punch list should specify who is responsible for addressing each item. This may include subcontractors, suppliers, or the general contractor, depending on who performed the original work. 4. Deadline for Completion A completion date should be assigned for each item to ensure timely resolution. Setting deadlines helps keep the project on track and avoids delays in final handover. 5. Status of the Item Each item should have a status indicator—such as “Pending,” “In Progress,” or “Completed”—to track progress as the list is being worked through and updated. 6. Approval or Sign-Off Once an item is completed, it must be reviewed and approved by the relevant party (usually the client, architect, or project manager). The punch list should include space for sign-off or confirmation to verify that the correction meets expectations. 7. Photos or Supporting Notes (Optional) Including photographs or notes can help clarify the issue, especially for complex items. Visual documentation can reduce miscommunication and provide evidence of completed work. Punch List Sample 🏗️ Punch List — Project Completion Review Project Name: Skyline Tower – Phase 2Location: Amman, JordanContractor: ABC Construction Co.Date Issued: 30/09/2025Prepared By: Project Engineer – Eng. Ahmad Khalil Item No. Location / Area Description of Work to be Completed / Corrected Responsible Party Priority Target Completion Date Status / Comments 1 Lobby – Main Entrance Touch up wall paint where scratched near reception desk Painting Subcontractor High 03/10/2025 Pending 2 5th Floor Corridor Replace damaged ceiling tile near Room 503 Ceiling Subcontractor Medium 05/10/2025 In Progress 3 Rooftop Install missing safety handrail section on east side Steel Works Subcontractor High 02/10/2025 Urgent 4 Basement Parking Repaint faded parking bay lines (B2 level) General Contractor Low 07/10/2025 Not Started 5 Electrical Room – Level 3 Label all electrical panels as per spec Electrical Subcontractor Medium 04/10/2025 In Progress 6 Exterior Façade – South Elevation Clean remaining construction debris & adhesive stains on glass Façade Contractor Low 06/10/2025 Not Started 7 Apartment 1204 Adjust misaligned door to ensure proper closing Carpentry Subcontractor Medium 05/10/2025 Pending Always Know Where Your Construction Project Really Stands Managing schedules, progress updates, and claims shouldn’t mean chasing site teams or drowning in spreadsheets. Opteam connects the field with the office in real time — giving you a clear, accurate picture of your project’s health without manual data crunching. Stop guessing. Stop waiting for outdated reports. Opteam puts control back in your hands. 👉 Sign Up Free — Start Your 14-Day Trial